
- ◆ UVC LED
- ◆ QSI Laser Diode
- ◆ LG UVLED
- ◆ TESMOCVD
Address:7th Floor, Gaofeng Building, Dalang Street, Longhua District, Shenzhen
Website:www.longstartech.com.cn
TEL:0755-2556 9680
FAX:0755-2556 6650
Mobile:13316929948(同V)
Email:James@longstartech.com.cn
Contact Person :James
Definition of light distribution curve
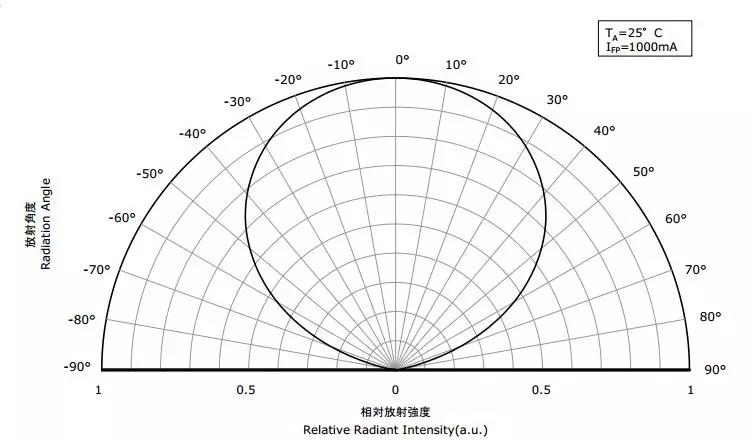 It refers to the light intensity distribution of the light source in all directions of space.
Said method
1. Polar coordinate light distribution curve (as shown in the figure above)
The intensity of the light source at different angles is measured on the metering plane through the center of the light source. Starting from a certain direction, the light intensity of each Angle is marked with a vector as a function of the Angle. The connection at the top of the vector is the polar coordinate distribution curve of the light source.
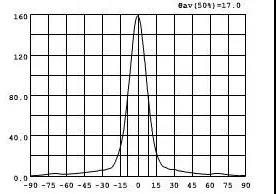 2. Rectangular coordinate light distribution curve (as shown in the figure above)
For concentrated light source, it is difficult to use polar coordinates to express the spatial distribution of its light intensity due to the concentration of light beam in a very narrow spatial solid Angle.
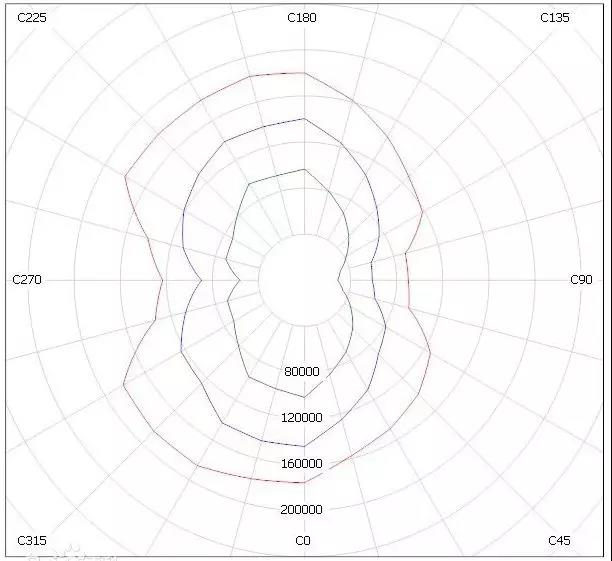 3. Light intensity curve (as above)
The curves that connect the top of vectors with equal light intensity are called equal light intensity curves, and the values of adjacent light intensity curves are arranged in a certain proportion, and the graphs composed of a series of equal light intensity curves are called equal light intensity graphs. The commonly used graphs include circular network graphs, rectangular network graphs and positive arc network graphs. The rectangular network diagram can not only show the light intensity distribution of the light source, but also show the regional distribution of light quantity.
